Note
Click here to download the full example code
Computing a camera image with custom emissivity
This tutorial defines an emissivity that varies in space and computes the signal received by a camera using this emissivity.
We start by loading a built-in tofu configuration and define a 2D camera.
import matplotlib.pyplot as plt
import numpy as np
import tofu as tf

configB2 = tf.load_config("B2")

cam2d = tf.geom.utils.create_CamLOS2D(
    config=configB2,
    pinhole=[3.4, 0, 0],
    sensor_nb=100,
    focal=0.1,
    sensor_size=0.1,
    orientation=[np.pi, np.pi/6, 0],
    Name="",
    Exp="",
    Diag="",
)
Out:
/home/lasofivec/miniconda3/envs/newtofu3/lib/python3.9/site-packages/numpy/core/fromnumeric.py:3208: VisibleDeprecationWarning: Creating an ndarray from ragged nested sequences (which is a list-or-tuple of lists-or-tuples-or ndarrays with different lengths or shapes) is deprecated. If you meant to do this, you must specify 'dtype=object' when creating the ndarray.
  return asarray(a).size
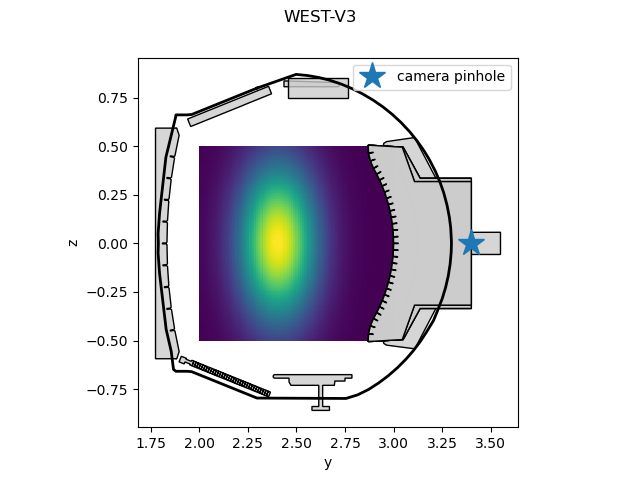
Now, we define an emissivity function that depends on r and z coordinates. We can plot its profile in the (0, X, Z) plane.
def emissivity(pts, t=None, vect=None):
    """Custom emissivity as a function of geometry.

    :param pts: ndarray of shape (3, npts) (each column is a xyz coordinate)
    :param t: optional, time parameter to add a time dependency to the
        emissivity function
    :param vect: optional, ndarray of shape (3, npts), if anisotropic
        emissivity, unit direction vectors (X,Y,Z)
    :return:
        - emissivity -- 2D array holding the emissivity for each point in the
            input grid
    """
    r, z = np.hypot(pts[0, :], pts[1, :]), pts[2, :]
    e = np.exp(-(r - 2.4) ** 2 / 0.2 ** 2 - z ** 2 / 0.4 ** 2)
    if t is not None:
        e = np.cos(np.atleast_1d(t))[:, None] * e[None, :]
    else:
        # as stated in documentation of calc_signal, e.ndim must be 2
        e = np.reshape(e, (1, -1))
    return e


y = np.linspace(2, 3, num=90)
z = np.linspace(-0.5, 0.5, num=100)
Y, Z = np.meshgrid(y, z)
X = np.zeros_like(Y)
pts = np.c_[X.ravel(), Y.ravel(), Z.ravel()].T
emissivity_vals = emissivity(pts)
emissivity_vals = emissivity_vals.reshape(X.shape)


def project_to_2D(xyz):
    """Projection to (0, X, Z) plane."""
    return xyz[0], xyz[2]


fig, ax = plt.subplots()
ax.pcolormesh(Y, Z, emissivity_vals)
ax.set_xlabel('y')
ax.set_ylabel('z')
configB2.plot(lax=ax, proj='cross')
cam_center, = ax.plot(*project_to_2D(cam2d._dgeom['pinhole']), '*', ms=20)
ax.set_aspect("equal")
ax.legend(handles=[cam_center], labels=['camera pinhole'], loc='upper right')
Out:
/home/lasofivec/tofu/examples/tutorials/tuto_plot_custom_emissivity.py:72: MatplotlibDeprecationWarning: shading='flat' when X and Y have the same dimensions as C is deprecated since 3.3.  Either specify the corners of the quadrilaterals with X and Y, or pass shading='auto', 'nearest' or 'gouraud', or set rcParams['pcolor.shading'].  This will become an error two minor releases later.
  ax.pcolormesh(Y, Z, emissivity_vals)

<matplotlib.legend.Legend object at 0x7f3163ae3df0>
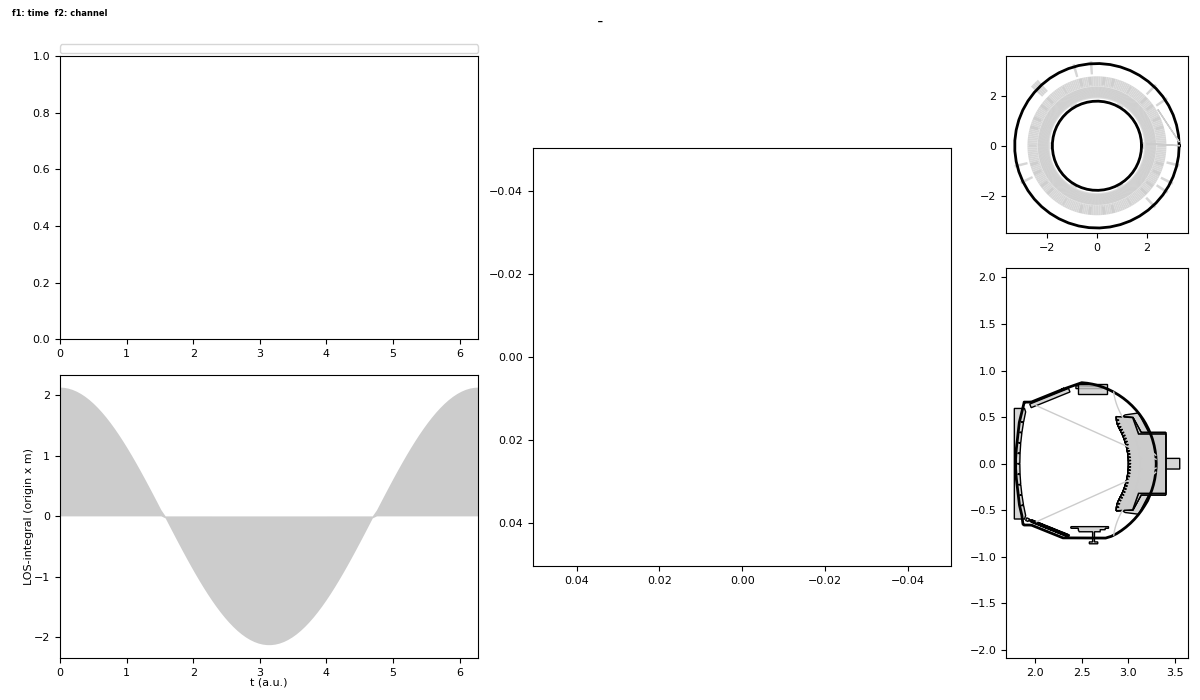
Finally, we compute an image using the 2D camera and this emissivity. If we provide a time vector, the field will vary in a cosinusoidal fashion (see above definition) across time.
time_vector = np.linspace(0, 2 * np.pi, num=100)

sig, units = cam2d.calc_signal(emissivity,
                               res=0.01,
                               reflections=False,
                               minimize="hybrid",
                               method="sum",
                               newcalc=True,
                               plot=False,
                               ani=False,
                               t=time_vector)

sig.plot(ntMax=1)
plt.show(block=False)
Out:
/home/lasofivec/tofu/tofu/data/_plot.py:268: MatplotlibDeprecationWarning:
The set_window_title function was deprecated in Matplotlib 3.4 and will be removed two minor releases later. Use manager.set_window_title or GUI-specific methods instead.
  fig.canvas.set_window_title(wintit)
No handles with labels found to put in legend.
/home/lasofivec/tofu/tofu/utils.py:3476: UserWarning: Not interactive backend!:
    - backend : agg   (prefer Qt5Agg)
    - canvas  : FigureCanvasAgg
  warnings.warn(msg)
Total running time of the script: ( 0 minutes 3.642 seconds)