Note
Click here to download the full example code
Creating a geometry with Inkscape
This is a tutorial that shows you how to draw a geometry in Inkscape and load it in tofu.
To see a tutorial on how to draw a vessel’s geometry on Inkscape by tracing an image from a PDF file for example, and save it to a svg file, to load it and use it in tofu, you can check the video below. Basically, you just need to use straight Bezier curves to draw the closed polygons that will define the vessel and optionally the structures. To define a PFC structure, just add a fill color. You can also draw a line to automatically scale the configuration to a known measure.
Now, on how to load it and use it in tofu (also shown in the video). We start by importing tofu.
import tofu as tf
tofu provides a geometry helper function that allows creating a configuration from a svg file. Supposing you saved it in a file named “myfirstgeom.svg”, do
config = tf.geom.Config.from_svg("myfirstgeom.svg", Name="Test", Exp="Test")
Out:
The following structures were loaded:
        - Ves: vessel (9 pts, None)
        - PFC: struct1 (5 pts, #000080)
        - PFC: struct2 (5 pts, #d40000)
from /home/lasofivec/tofu/examples/tutorials/myfirstgeom.svg
It already gives you some information on what you loaded, but to see what it actually contains:
print(config)
Out:
tot. Struct  tot. occur  tot. points
-----------  ----------  -----------
3            3           15

class  Name     SaveName                                               nP  noccur  move  color                     visible
-----  -------  -----------------------------------------------------  --  ------  ----  ------------------------  -------
Ves    vessel   TFG_Ves_ExpTest_vessel_sh00000_Vers1.5.0-3-g96c1c10c   7   0       None  ( 0.0,  0.0,  0.0,  1.0)  True
PFC    struct1  TFG_PFC_ExpTest_struct1_sh00000_Vers1.5.0-3-g96c1c10c  4   0       None  ( 0.0,  0.0,  0.5,  1.0)  True
PFC    struct2  TFG_PFC_ExpTest_struct2_sh00000_Vers1.5.0-3-g96c1c10c  4   0       None  (0.83,  0.0,  0.0,  1.0)  True
To plot it, simply do
config.plot()
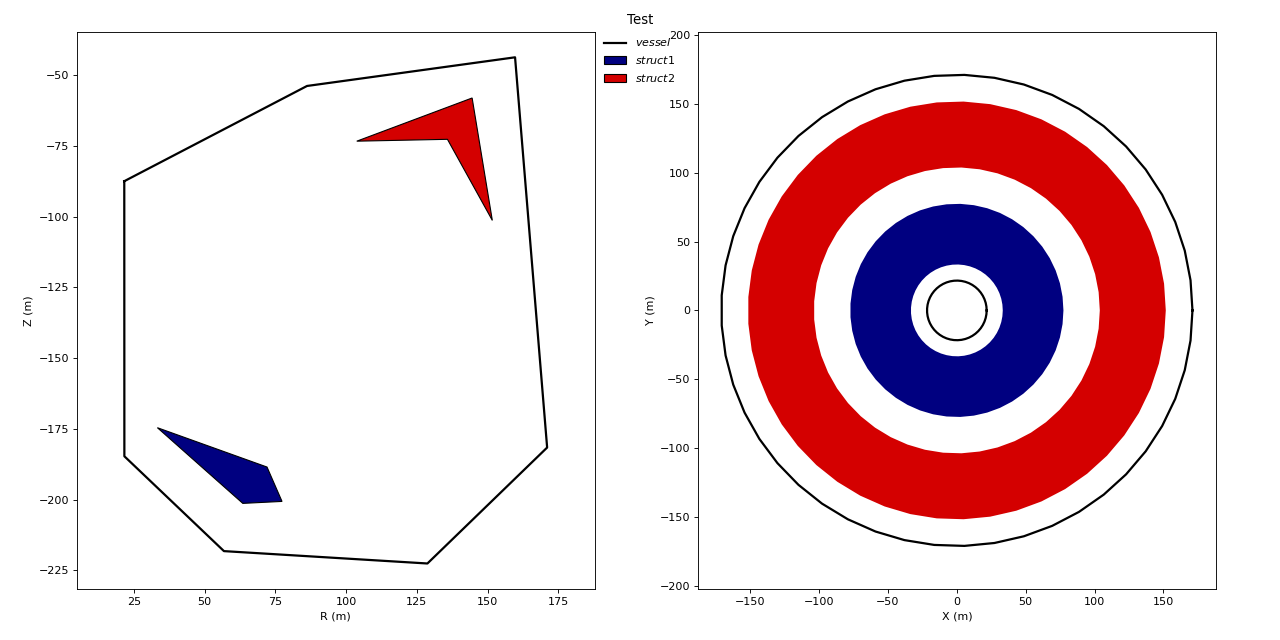
Out:
/home/lasofivec/tofu/tofu/geom/_def.py:127: MatplotlibDeprecationWarning:
The set_window_title function was deprecated in Matplotlib 3.4 and will be removed two minor releases later. Use manager.set_window_title or GUI-specific methods instead.
  f.canvas.set_window_title(wintit)

[<AxesSubplot:xlabel='R (m)', ylabel='Z (m)'>, <AxesSubplot:xlabel='X (m)', ylabel='Y (m)'>]
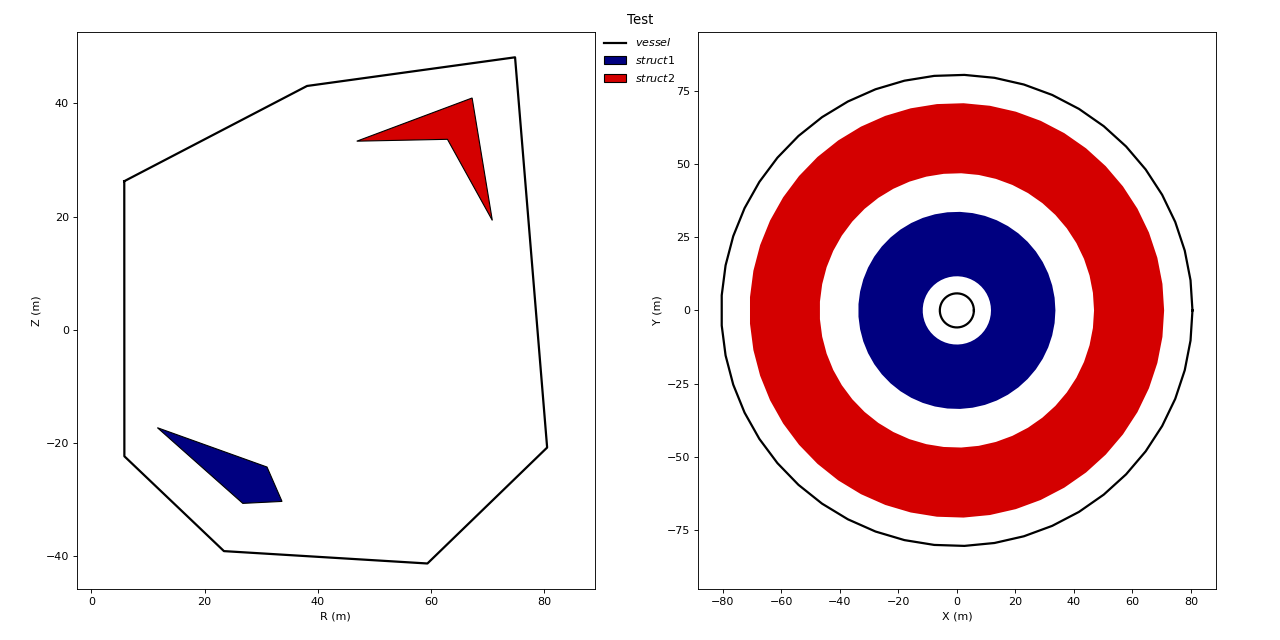
We can see that the z- and r-axis might not be exactly what we wanted. We might also want to adjust the scale. Tofu let’s fix those parameters when loading the configuration.
config = tf.geom.Config.from_svg("myfirstgeom.svg", Name="Test", Exp="Test",
                                 z0=-140,
                                 r0=10,
                                 scale=0.5
                                 )
config.plot()
Out:
The following structures were loaded:
        - Ves: vessel (9 pts, None)
        - PFC: struct1 (5 pts, #000080)
        - PFC: struct2 (5 pts, #d40000)
from /home/lasofivec/tofu/examples/tutorials/myfirstgeom.svg
/home/lasofivec/tofu/tofu/geom/_def.py:127: MatplotlibDeprecationWarning:
The set_window_title function was deprecated in Matplotlib 3.4 and will be removed two minor releases later. Use manager.set_window_title or GUI-specific methods instead.
  f.canvas.set_window_title(wintit)

[<AxesSubplot:xlabel='R (m)', ylabel='Z (m)'>, <AxesSubplot:xlabel='X (m)', ylabel='Y (m)'>]
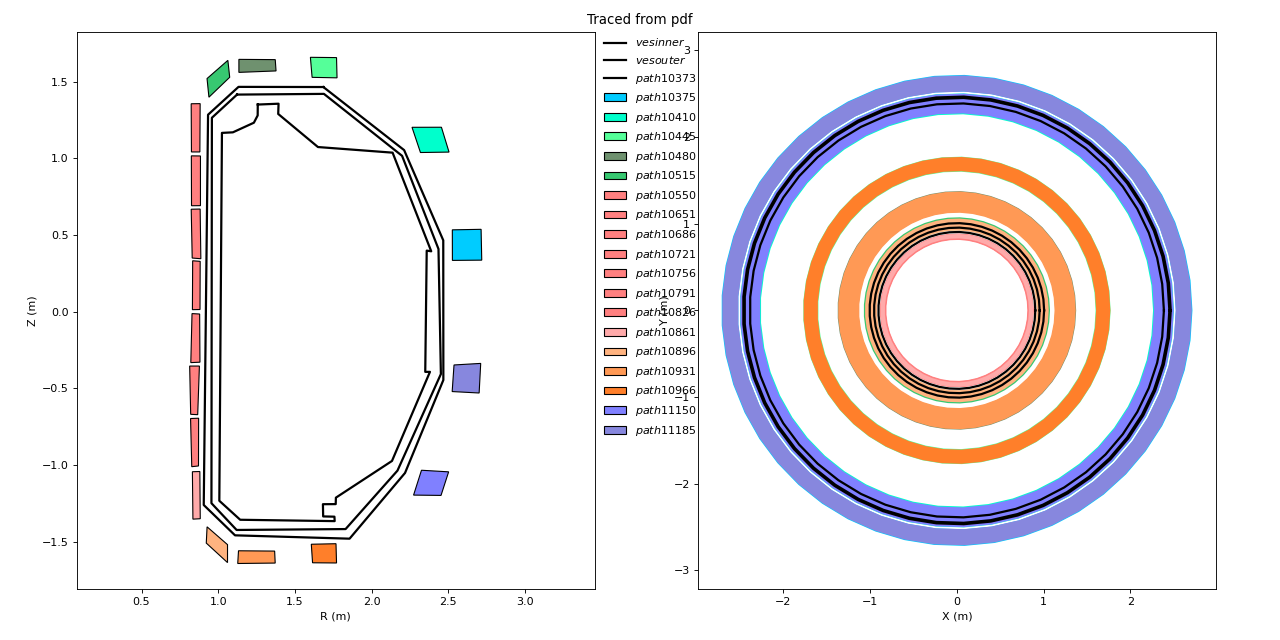
Or, even better, if you have a figure where there is known measure you can let tofu scale the figure automatically for you
config = tf.geom.Config.from_svg(
    "from_pdf.svg",
    Name="Traced from pdf",
    Exp="Test",
    res=10,
    point_ref1=(0.7, -2),
    point_ref2=(2.8, 2)
)
config.plot()
# sphinx_gallery_thumbnail_number = 3
Out:
The following structures were loaded:
        - Ves: path10373 (23 pts, None)
        - Ves: vesinner (11 pts, None)
        - Ves: vesouter (11 pts, None)
        - PFC: path10375 (5 pts, #00ccff)
        - PFC: path10410 (5 pts, #00ffcc)
        - PFC: path10445 (5 pts, #55ff99)
        - PFC: path10480 (5 pts, #6f916f)
        - PFC: path10515 (5 pts, #37c871)
        - PFC: path10550 (5 pts, #ff8080)
        - PFC: path10651 (5 pts, #ff8080)
        - PFC: path10686 (5 pts, #ff8080)
        - PFC: path10721 (5 pts, #ff8080)
        - PFC: path10756 (5 pts, #ff8080)
        - PFC: path10791 (5 pts, #ff8080)
        - PFC: path10826 (5 pts, #ff8080)
        - PFC: path10861 (5 pts, #ffaaaa)
        - PFC: path10896 (5 pts, #ffb380)
        - PFC: path10931 (5 pts, #ff9955)
        - PFC: path10966 (5 pts, #ff7f2a)
        - PFC: path11150 (5 pts, #8080ff)
        - PFC: path11185 (5 pts, #8787de)
from /home/lasofivec/tofu/examples/tutorials/from_pdf.svg
/home/lasofivec/tofu/tofu/geom/_def.py:127: MatplotlibDeprecationWarning:
The set_window_title function was deprecated in Matplotlib 3.4 and will be removed two minor releases later. Use manager.set_window_title or GUI-specific methods instead.
  f.canvas.set_window_title(wintit)

[<AxesSubplot:xlabel='R (m)', ylabel='Z (m)'>, <AxesSubplot:xlabel='X (m)', ylabel='Y (m)'>]
Total running time of the script: ( 0 minutes 0.950 seconds)